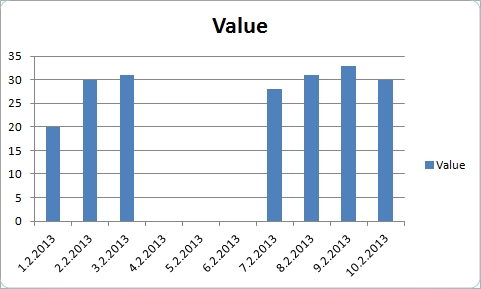
Missing date in the chart
The table in this example shows dates and values. There is a missing dates. It causes a big blank space in the chart.

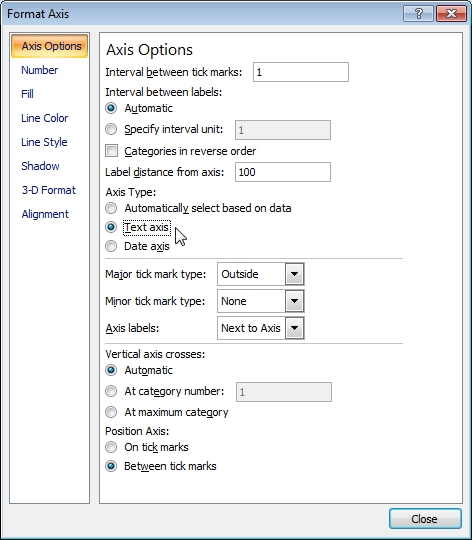
Excel provides options to display dates on the axis that can fix this blank space. Do right-click on the Y-axis and select Format Axis.

In the Format Axis menu find Axis Type and switch it to the Text axis value.
Dates in the chart have no blank space, now.

How to skip date in my chart.
Is there another solution? I need to keep axis type as Date axis. Maybe I have to do something with my data source, but I don’t know what. Can anyone help me?
Thanks in advance.
Simple solution: hide empty place in Excel graph. Thank you.
I was always wondering how to hide blank dates in chart. We have similar Excel file and this is very helpful and it solves our issues.
Thank you.