Automatic change in the chart according to the current date
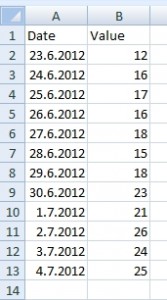
Let’s have a list of some values. The values are taken every day. The task is to create chart showing only last 5 days from today. Charts must be updated automatically.
Important: I wrote this on 4.7.2012, so for this example is 4.7.2012 the current date.
Solution
Step 1 / new table
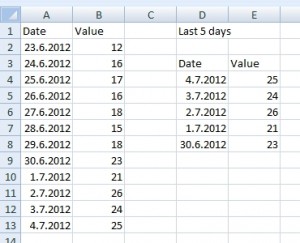
We create a new table that shows only last 5 days from today.
First of all we have to determine current date. Formula in D4 is:
=TODAY()
Then we subtract 1, 2, 3 and 4 days from the current day. Formula in D5 is:
=D4-1
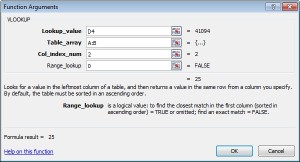
Now, we use VLOOKUP function to find right values to the dates. Formula in E4 is:
=VLOOKUP(D4,A:B,2,0)
Argument “Table array” is A:B because we need include all values in column A and B. Therefore, we can add more values to the list of dates and this formula will work correctly.
Step 2 / chart
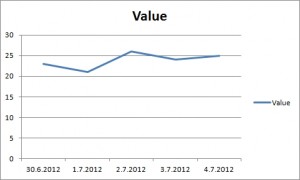
We create new chart from this auxiliary table. I choose Line chart, but it’s up to you which one you need.


Do you think that better solution will be if I use Format as Table? It will automatically grow the table range and graph will be also updated. But I like your example with VLOOKUP. I love this formula. It saved me a lot of time because I do not need to use VBA macro for many issues.
hi