Running total for multiple items solved by Pivot Table and Line Chart
Creating running total is easy and simple if you use a Pivot Table. I show you an example with a few steps, video guide is included.
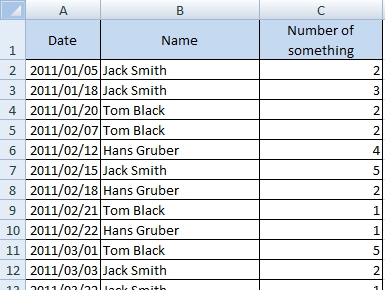
Source data
We have several people who collect some points. The task is to show and analyze how they gradually accumulate the points.
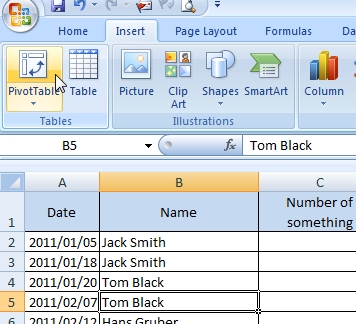
Step 1 – create pivot table
Click on to the source data and go to the menu Insert >> PivotTable.
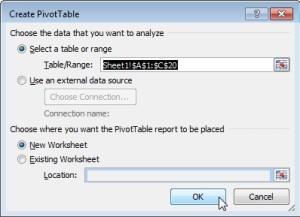
Check the Table/Range field and choose where will be the Pivot Table placed. Confirm the Create PivotTable dialog.
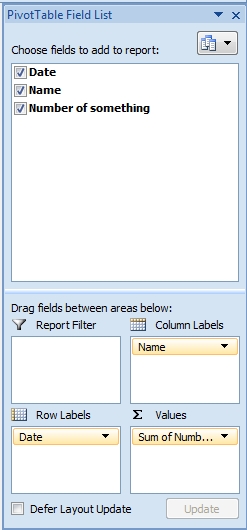
Go to the PivotTable Field List and move:
Name field to Column Labels,
Date field to Row Labels,
Points (Number of someth.) to Values.
If the PivotTable Field List is not displayed, go to the PivotTable Tools menu >> Options >> Field List (on Show/Hide).
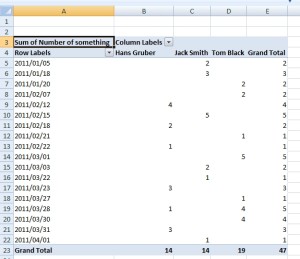
Pivot Table should look like this. It shows sum of points (Number of something) for each date and person.
Step 2 – set values as running total
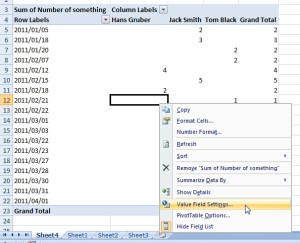
Right click on the values and select Value Field Settings…
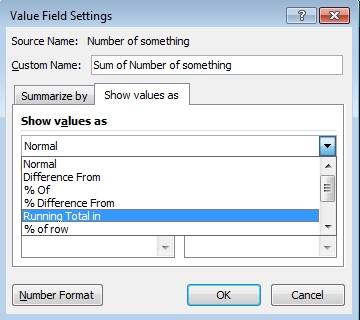
Go to the card Show values as and select Running Total in. Keep Date as Base field.
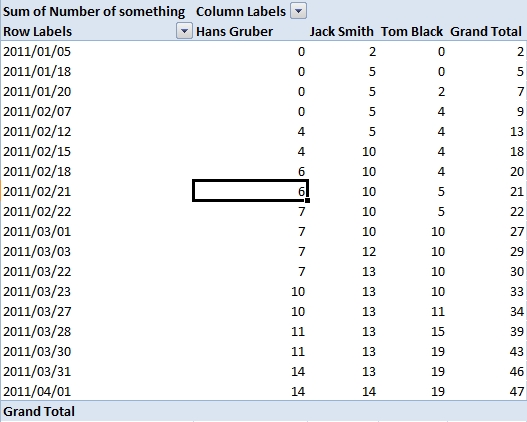
Now, the Pivot Table shows running total in dates for each person.
Step 3 – create Pivot Line Chart
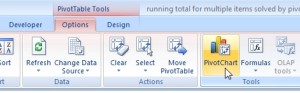
Click on the Pivot Table and go to the PivotTable Tools menu and select PivotChart.
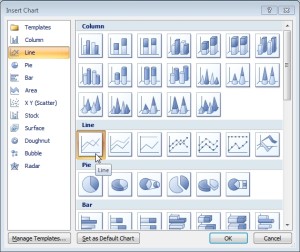
Choose Line.
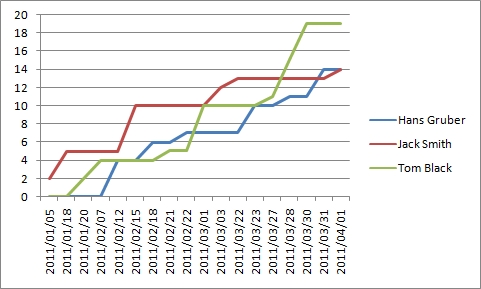
Final Line Chart looks like that.
Really good answer to the question What is the running total. Thanks. I think I will use this in my school lessons.
not bad
Not bad at all fellas and galasl. Thanks.