The difference between a line chart and a scatter chart
People often ask: Should I use the line or the scatter? In this article, I try to explain the difference and when to use each chart type.
The basic difference is that the line chart shows only the one value and the scatter chart shows the relationship between two values. Let’s look at this issue more closely.
Line chart
The values are plotted only on the vertical axis (Y-axis). On the horizontal axis (X-axis) is the sequence number of the value. Exceptions are graphs with the date on the X-axis.
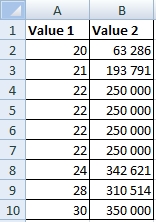
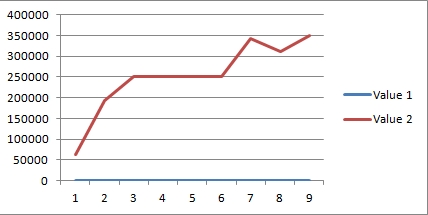
The line chart for this table contains two lines because there are two data series (Value1 and Value2). The line of Value 1 (blue) is down because Value1 and Value2 are in very different scale. On the X-axis you can see numbers 1 to 9, that’s because we have 9 rows in the source table.
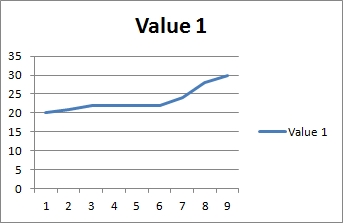
The line chart of the Value 1 is on the following picture. You can see that the values are on the vertical axis (Y-axis) and on the horizontal axis (X-axis) are still only the sequence numbers.
The line chart for Value 2:
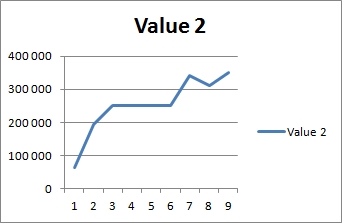
As you can see in the previous examples, the line chart shows each data series (values in columns) separately into the color lines.
Scatter chart
When you want to show the relationship between two values, use the scatter chart. Scatter is often called XY chart.

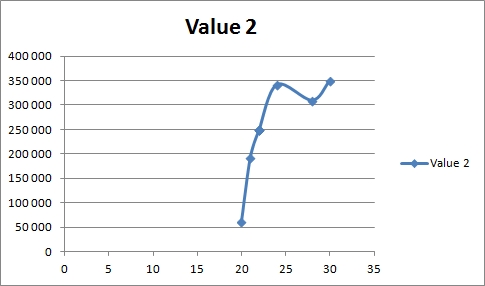
On the following picture is the scatter chart for Value 1 and Value 2. On the vertical axis (Y-axis) are Values 1 and on the horizontal axis (X-axis) are Values 2. In this chart are only 6 points, it’s because 4 of the rows have the same XY coordinate (Value1=22, Value2=250000).
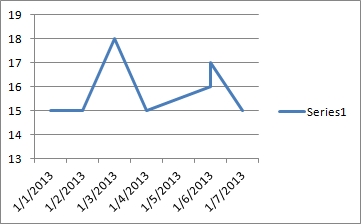
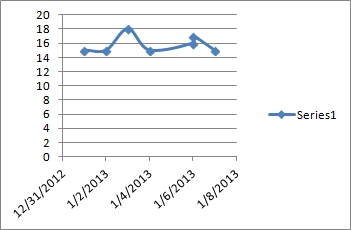
Line and scatter chart with the date
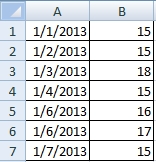
The line and the scatter chart of this table are nearly the same.

Hello,
Very good explanation Line vs Scatter graph problem. Thank you
Thanks a lot. Very helpful.
Thanks for the best information!:)
Thanks for your thshguto. It’s helped me a lot.