Chart: Automatic update when data source changes
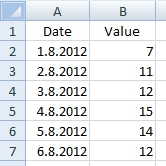
Chart created from a simple data table is static and when the source changes, the chart has to be update manually. There is a possibility how to update the chart automatically. Table on the following picture is the source of the chart.
The chart can be simple like this:
Solution
Excel 2007 and higher contains menu Format as Table. Chart, created from such a table, updates itself when you add rows or columns. So, just select the table and choose one of the styles from Format as Table.
See this on video tutorial:


I want to update my graph after my table grows. This can be the way. It is great that I dont need a VBA macro. How it works when I put new row into table not in the end?